
FAQ – The Reports
Body Composition
BFP (Body Fat Percentage) %
Body Fat Percentage (often written as BF%) is the proportion of your body weight that comes from fat, compared to everything else (muscle, bone, water, organs, etc.).
Why it matters:
- Health indicator: Too high or too low can affect health.
- Fitness progress: More useful than weight alone, since it reflects body composition.
- Performance & aesthetics: Athletes often monitor BF% to optimize strength, endurance, or appearance.
General ranges (for women, approximate):
- Essential fat: 10–13% (needed for normal body function)
- Athletes: 14–20%
- Fitness: 21–24%
- Average: 25–31%
- Obese: 32%+
Fat Mass (FM) kg
Fat Mass (FM) is the total weight of all the fat in your body.
It includes both:
- Essential fat: the minimum fat your body needs to survive (for organs, nerves, hormone regulation, reproductive health).
- Storage fat: extra fat stored under the skin (subcutaneous fat) and around internal organs (visceral fat).
Why it matters:
- Helps track body composition changes (losing fat vs. losing muscle).
Lean Body Mass (kg)
Lean Body Mass (LBM) is the part of your body weight that is not fat. It includes:
- Bone
- Muscle
- Organs
- Body water
- Other tissues
Lean Body Mass = Total Body Weight − Fat Mass
Example:
- Total body weight: 60 kg
- Body fat: 15 kg (25%)
- Lean Body Mass = 60 – 15 = 45 kg
Why it matters:
- Metabolism: More lean mass → higher resting metabolism (burn more calories at rest).
- Strength & performance: Muscles are key to functional movement, stability, and endurance.
- Health: Maintaining lean mass helps prevent injuries, supports bone health, and improves aging outcomes.
Training with Heart Rate
What is Heart Rate?
HR or Heart Rate is our pulse and is measured in BPM units – beats per minute – how many beats our heart beats in one minute.
Checking your heart rate at rest, during exercise, or after energetic exercise can give you important information about your overall fitness level. Your heart rate is changing based on physical activity. If you check your heart rate when you just wake up in the morning, it will beat in its lowest rate. This is called a Resting pulse or Resting HR.
According to the National Institute of Health, the average resting heart rate is 60 – 100 beats per minute (well-trained athletes HR is 40 – 60 BPM). Spivi allows you to see your heart rate performance over time (last 30 days, last 90 days, last 180 days, and last year) in the My Workouts section of spivi.com, under Trends.
Why do we measure our HR during a workout?
First, we want to make sure that our workout is efficient. We don’t want to exercise too hard or not hard enough. Second, it can help set personal goals during a workout. The workout goals are set in % of each member’s Maximum Heart Rate and enable members to exercise based on their own abilities.
Max HR: Max HR is the maximum rate your heart can beat per minute. The standard formula to estimate Max HR is 220 – age. However, to achieve a more accurate Max HR value, you should conduct a Max HR test.
Target Heart Rate or Training Heart Rate (THR): During workout we should aim to our Target Heart Rate for efficient workout, meaning, to enable the heart and lungs to receive the most benefit of it.
To check our THR during a workout, we need to count our pulse for 10 seconds while exercising, and multiply by 6 to find the Beat Per Minute (BPM). The THR should be between 65%-88% of the Max HR.
Keep in mind that everyone is different, and you need to be aware of how you feel during the workout and how hard you work. LTHR Lactate Threshold Heart Rate (LTHR) is the maximum average heart rate that one can sustain during a 60-minute time trial. During this test member should aim to their highest possible heart rate.
How to wear a heart rate monitor? (wrist)
In order to pair your heart rate monitor with your Spivi® profile you should wear it and turn it on. Here are the steps you need to take in order to wear the monitor properly before you start pairing:
Heart Rate Wrist
- Place the heart rate wrist just a few cm from your wrist (about 2-3 fingers) toward the elbow on the inside of the arm. It should sit tight but comfortable around the arm.
- Turn the wrist ON.
What is Max HR?
Max HR (MHR) is the maximum rate your heart can beat per minute. I.E if your heart beats at its maximum rate at 3 times per second (180 times per minute) then your Max HR is 180.
Max HR reflects the upper limit that your cardiovascular system can handle during a workout. It is one of the most efficient fitness attributes for setting training goals.
Instructors and Studios working with HR monitors can use the Max HR attribute to design a class profile based on the Max HR zones.
A good rule of thumb for an efficient workout is to exercise within 55%-88% of the Max HR for at least 20 to 30 minutes.
Determining Max HR The standard formula to estimate Max HR is 220 – age. However, to achieve a more accurate Max HR value, one should conduct a Max HR test. When conducting a Max HR test in HR based cycling workouts, members should cycle as fast as they can with a high level of resistance. In generic cardio workouts, members should exercise at their maximum effort.
The Max HR value will be determined by the highest HR sampled. Spivi offers multiple versions of Max HR test covering any fitness level of participants from beginners to professional athletes. For beginners, we recommend using the 1 minute Max HR test. During the test, the heart rate in BPM units is sampled and compared to the current Max HR value. Each time a higher value is detected the system replaces the Max HR value with the sampled value.
Max HR can also be manually updated from the Spivi user profile interface.
Training with Max HR Training using %Max HR is the basis for all HR training programs (HR based cycling workouts and generic cardio workouts). The goals are defined in %Max HR units and not in BPM units because each individual has a different Max Heart Rate value. Using this method allows members to work at class according to their own fitness abilities. For an efficient and accurate HR based workout the Max HR value should be updated on each user profile either by conducting a test during a class with the Spivi system or by manually updating it on the user profile level.
Max HR View One of the most efficient ways to guide the class to work on a specific training zone is to use the color-coded views. When training with HR it will be the Max HR View which is based on Max HR zones. The Max HR View on a Spivi System displays the HR output of each trainee in %Max HR. For example, if a trainee during a workout is 150 HR in BPM units and his Max HR is 180 then the displayed %Max HR will be 83% which is simply 150 / 180. 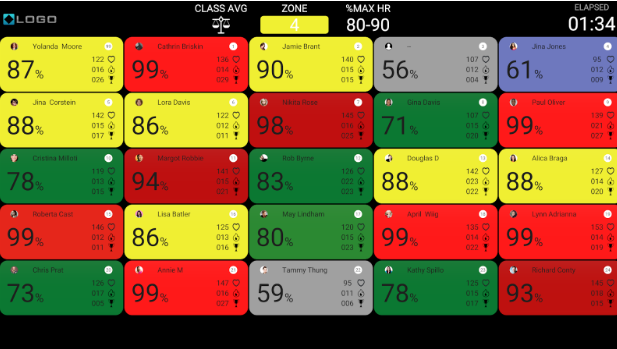
Max HR View
The Max HR color coded view displays real time performance metrics of the group during the workout. The dashboard shows the relevant metrics such as %Max HR, HR, SEP, and Burned Calories. 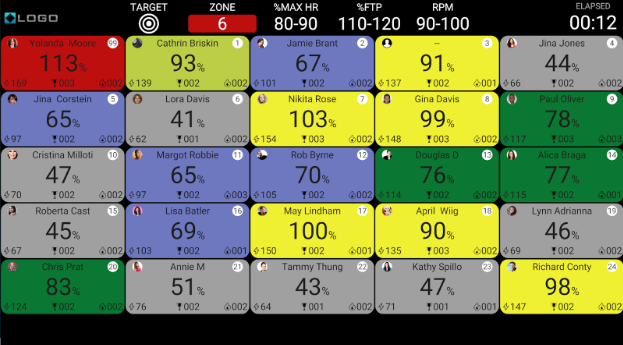
The Max HR color coded view displays real time performance metrics of the group during the workout. The dashboard shows the relevant metrics such as %Max HR, HR, SEP, and Burned Calories. The colors of the squares represent the zone the member is in.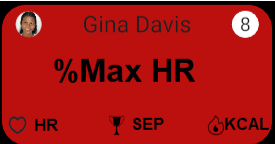
What is LTHR?
Lactate Threshold Heart Rate (LTHR) is your maximal average heart rate output over an hour workout. I.E if you can work with an average of 180 BPM during a 60 minutes workout your LTHR is 180. LTHR gives a more accurate personal HR score, then the Max HR score, when working with HR training zones. It doesn’t change much during the time if you are in shape and can help you set personal training goals during a workout. Yet, it is recommended to test your LTHR every few months.
Determining LTHR The best way to estimate one’s LTHR is by conducting an LTHR test. There are multiple standard versions of an LTHR test. Each version is defined by a different period (3 Minutes, 5 Minutes, 8 minutes, 20 Minutes etc) and by a different factor. The period defines the test duration, and when a test is completed, the averaged HR is multiplied by the different factors to compute the final LTHR value. Spivi offers multiple versions of the LTHR test covering any type of participants from beginners to professional athletes. For beginners, we recommend using the 3 or 5 minutes LTHR test. During that test, everyone should work with their highest possible Heart Rate output. In the 3 minutes test, Spivi will compute the average Heart Rate during the test and will take 80% of it as the computed LTHR. For example, if your average HR during this test will be 200 BPM then Spivi will set your LTHR value to 160 BPM. LTHR can also be manually updated on a Spivi user profile interface.
Training with LTHR Training using %LTHR targets is a very precise and useful factor in any Heart Rate training program (HR based cycling workouts and generic cardio workouts). Similar to %Max HR, The goals are defined in %LTHR units and not in BPM units, because each individual has a different LTHR value. Using this method allows members to work at class according to their own fitness abilities. For an efficient and accurate HR based workout the LTHR value should be updated on each user profile either by conducting a test during a class with the Spivi system or by manually updating it on the user profile level.
LTHR View One of the most efficient ways to guide the class to work on a specific training zone is to use the color-coded views. When training with HR monitors it will be the LTHR View which is based on LTHR zones. The LTHR View on a Spivi Arena System displays the HR output of each trainee in %LTHR units. For example, if a trainee produces 150 BPM and his LTHR is 160, then the displayed %LTHR will be 93% which is simply 150 / 160. 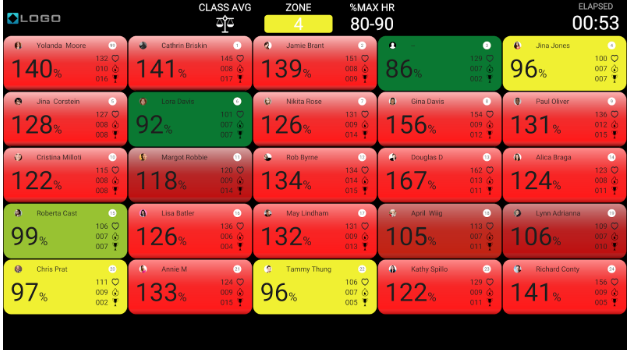
LTHR View
The LTHR color coded view displays real time performance metrics of the group during the workout. The dashboard shows the relevant metrics such as %LTHR, HR, SEP, and Burned Calories. 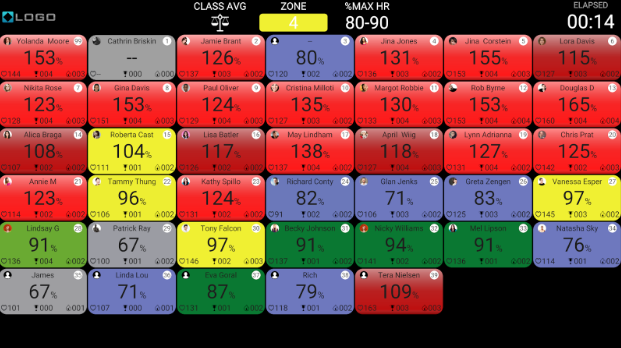
The colors of the squares represent the zone the member is in.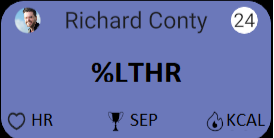
Training with Power/Cadence
What is Power?
Power is energy over time and is measured in Watts units. It is a product of your cadence and resistance level. Training with Power is only available in cycling and requires power sensors equipped bikes. Power is the work output, meaning how much effort you put while pedaling the bike, in each second.
When training with Power, it is important to track Watts over time. Measuring the highest Watts output doesn’t reveal your real performance abilities. You need to check what is the highest Watts output you can sustain over time.
Spivi allows you to see your Power performance over time (last 30 days, last 90 days, last 180 days, and last year) in the My Workouts section of spivi.com, under Trends.
FTP Functional Threshold Power (FTP) is the maximum average wattage that one can sustain during a 60-minutes time trial on a flat road. Training with %FTP is a key element in any power-based cycling training program. Training with % of FTP allows members to train based on their fitness abilities. To estimate your FTP score, you should conduct an FTP test.
W/Kg Another way to measure Power is by calculating how much weight in Kg we can move to generate the Watts. To do that, you simply divide Watts in your weight in Kilograms. A cyclist weighing 190 pounds (86 kg) will need to generate more Watts than a 110 pound (50 kg) cyclist to maintain the same speed when using the same resistance. If you check their W/Kg, you’ll be able to compare their power outputs.
To measure your power output, you can divide your FTP score with your weight in Kg. The result is the W/kg output of your FTP (maximal average power output over an hour).
Kilojoules (Kj) A kilojoule is a measuring unit that lets us know how much energy was expended over a certain period. Joules are an international standard unit of work/energy. 1 Watt = 1 joule applied for 1 second. 1000 joules = 1 kilojoules (KJ) Kilojoules = watts X seconds / 1000 KJ can also be converted to Calories (Kcal), to display the burned calories during a workout: 1 kJ = 0.2 Calories (Cals) 1 Calorie = 4.2 kJ
What is FTP?
Functional Threshold Power (FTP): is your maximal average power output over an hour cycling on a flat road. I.E if you can cycle at an average of 250 watts during a 60 minutes workout your FTP is 250.
As a key metric in performance training, FTP is one of the most important fitness attributes on any user profile at Spivi. FTP changes frequently, depending on one’s fitness and can be used to track and identify performance trends. Increasing FTP value over time reflects improvement of your fitness level and vice versa. It is highly recommended to perform FTP tests every few weeks to track your fitness level and improve it over time.
Determining FTP: The best way to estimate one’s FTP is by conducting an FTP test. There are multiple standard versions of an FTP test. Each version is defined by a different period (3 Minutes, 5 Minutes, 20 Minutes etc) and by a different factor. The period defines the test duration, and when a test is completed, the average power is multiplied by the different factors to compute the final FTP value. Spivi offers multiple versions of FTP test covering any type of participants from beginners to professional athletes. For beginners, we recommend using the 3 or 5 minutes FTP test. During that test, everyone should work at their highest possible power output. Spivi will compute the average watts during the test and will take %80 of it as the computed FTP. For example, if your average power during this test will be 200 watts then Spivi will set your FTP value to 160. FTP can also be manually updated on a Spivi user profile interface.
Training with FTP: Training using %FTP targets is a key element in any power-based cycling training program. You can think about it as the equivalent method of heart rate based training where the goals are defined in %MaxHR units and not in BPM units. The reason is that each individual has a different Max Heart Rate value. When training with power the instructor should set the power goals for the class in %FTP units instead of watt units for the same reason, each one has a different FTP value. Using this method allows members to work at class according to their own fitness abilities. For an efficient and accurate power based workout the FTP value should be updated on each user profile either by conducting an FTP test during a class with the Spivi system or by manually updating it on the user profile level.
Power View: One of the most efficient ways to guide the class to work in a specific training zone is to use the color-coded views. When training with Power it will be the Power View which is based on FTP zones. The Power View on a Spivi System displays the power output of each trainee in %FTP units. For example, if a trainee produces 220 watts and his FTP is 200, then the displayed %FTP will be 110% which is simply 220 / 200.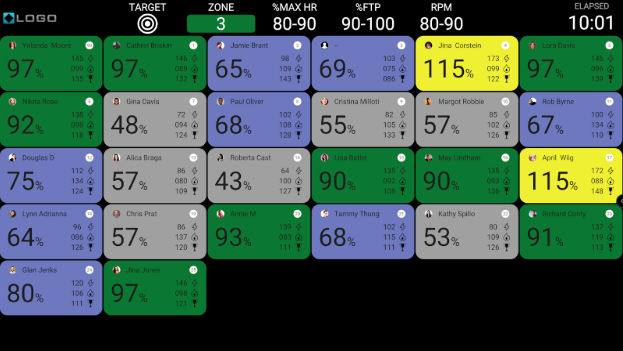
Power View
The Power color coded view displays real time performance metrics of the group during the workout. The dashboard shows the relevant metrics such as %FTP, Watts, SEP, and Burned Calories.  The colors of the squares represent the zone the member is in.
Cadence View
The Cadence color coded view displays real time performance metrics of the group during the workout. The dashboard shows the relevant metrics such as Cadence, SEP, and Burned Calories. 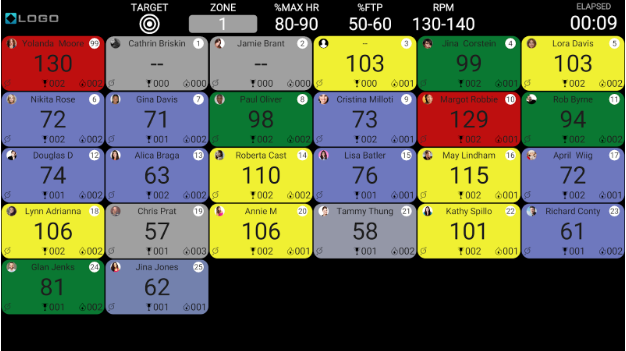 The colors of the squares represent the zone the member is in.
Leaderboard View
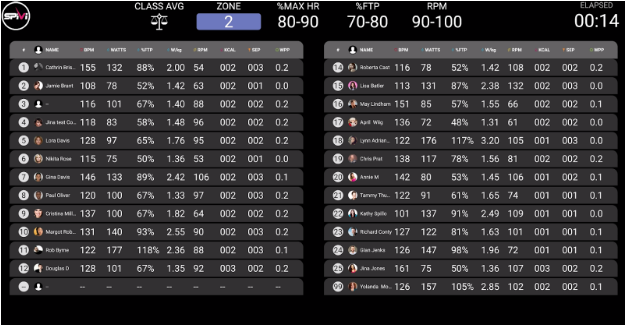
Spivi offers different leaderboard attributes that can be shown on screen. Each studio can configure the desired metrics to show.
POWER NOTE: Power attributes are available only in cycling, and requires power sensors equipped bikes.
- Power – Watts: Power is energy over time and is measured in Watts units. It is a product of your cadence and resistance level. Increasing your cadence or your resistance will result in higher watts output. Bottom line, power in watts units reflects your work output – how much energy you generate in each second while pedaling the bike.
- Power – %FTP: FTP – Functional Threshold Power is the maximum average wattage that one can sustain during a 60 minutes time trial on a flat road. Power goals are usually defined in %FTP in order to allow members to train based on their own fitness abilities. The FTP value of each member can be determined by running an FTP test or by manually updating the value on the Spivi user profile.
- Power – Watts/Kg: Another way to display Power is by calculating how much weight in Kg we can move to generate the Watts. In order to do that, we simply divide Watts in our weight in Kilograms. W/Kg allows us to compare the power output of different members.
- Energy | KJ: Kilojoules is a measuring unit that let us know how much energy was expended over a certain period of time. Kilojoules =(Watts x Seconds) / 1000. I.E in a 60-minute workout with an average power output of 200 Watts you’ll take out approximately 720 KJ = (200 x 3600) / 1000.
HEART RATE NOTE: Heart rate attributes require training with compatible heart rate monitors. Spivi supports any ANT+ certified monitor and the Polar H7, H10, OH1, and Polar Verity Sense Optical Heart Rate Sensor straps.
- Heart Rate – BPM: Heart Rate or HR is our pulse and is measured in BPM units (beats per minute). Checking our heart rate can give us important information about our overall fitness level.
- Heart Rate – %Max HR (%MHR): Max HR is the maximum rate our heart can beat per minute. Heart Rate goals are usually defined in %Max HR units in order to allow members to work according to their own fitness abilities. Max HR value of each member can be determined by running Max HR test or by manually updating the value on the Spivi user profile.
- Heart Rate -%LTHR: Lactate Threshold Heart Rate (LTHR) is the maximum average heart rate that a one can sustain during a 60-minute time trial. Training with Heart Rate goals defined by %LTHR units allow members to train based on their own fitness abilities. The LTHR value of each member can be determined by running the LTHR test or by manually updating the value on the Spivi user profile.
CADENCE
- Cadence –RPM: Cadence is the rate at which members turn the pedals during the workout and is measured in RPM units (Revolutions Per Minute).
SPEED
- Speed: Speed is defined as the distance covered divided by time. Speed is expressed in Miles Per Hour units (MPH) or Kilometers Per Hour units (KPH).
- Distance: Distance is an accumulated speed over time. In the Imperial measuring system distance is expressed in Miles units (MI) and in the Metric measuring system distance is expressed in Kilometers units (KM).
CALORIES
- Calories – Kcal: We use Kcal to measure energy expended in a physical activity over time. KCal are often known as burned calories and are important attributes to track when you’re aiming to reach your desired weight.
SPIVI METRICS
- Spivi Ecosystem Points (SEP): Spivi Ecosystem Points are a unique metric that was designed to allow members to gain a score based on their fitness level. Computing SEP is based on the type of activity, personal information and real-time performance data.
- Workout Program Points (WPP): Workout Program Points rewards members for training according to the workout goals. For each minute working out according to the program goals, a member earns 1 WPP.